
Exploring Kube Prometheus stack
Short intro
Somewhere in the coming weeks or months, I will attempt the CKAD (Certified Kubernetes Application Developer) to learn more about the cloud-native world. This also means that sometimes hands-on experience is the best way to learn. Learning is sometimes the fastest by just doing it and making mistakes. That is why I wanted to dive a little bit deeper into the Kube Prometheus stack.
Kubernetes cluster information
Currently, I am using a Kubernetes cluster from TransIP in the Netherlands which is having an open beta for their Kubernetes platform. This means that I create two Kubernetes clusters with a max of 9 nodes. The nodes can be configured with different specs.
Kubernetes cluster:
- Version: 1.26.3
- Nodes: 4
- VCPU: 2 per node
- RAM: 4GB per node
- Storage: 30GB NVMe
- LoadBalancers: HAPROXY
- OS-IMAGE: Ubuntu 22.04.2 LTS
- KERNEL-VERSION: 5.15.0-69-generic
- CONTAINER-RUNTIME: containerd://1.6.12
- Hosting provider: TransIP (BETA PLATFORM)
Kube prometheus stack
The kube-prometheus-stack helm chart takes care of a few different deployments:
- Prometheus - Is a time series database that scrapes, stores and exposes the metrics from your Kubernetes cluster and the applications running.
- Node-Exporter - Is an exporter which collects resource utilization data from the Nodes in your Kubernetes Cluster.
- Kube-State-Metrics - This exposes information about the API objects in your Kubernetes Cluster, such as Pods and containers.
- Grafana - Create dashboards with the data from Prometheus.
- Alertmanager - We don't use this in this setup.
Installing
Installing the helm chart
$ helm repo add prometheus-community https://prometheus-community.github.io/helm-charts
Updating the helm repo
$ helm repo update
Run the following command to deploy the chart in a new namespace on the cluster.
$ helm install kube-prometheus-stack \
  --create-namespace \
  --namespace kube-prometheus-stack \
  prometheus-community/kube-prometheus-stack
It can take a minute for it the complete the deployments. You can check the progress by running the following command:
$ kubectl get all -n kube-prometheus-stack
This command will return all resources in this namespace:
NAME                                                            READY   STATUS    RESTARTS        AGE
pod/alertmanager-kube-prometheus-stack-alertmanager-0           2/2     Running   1 (2d18h ago)   2d18h
pod/kube-prometheus-stack-grafana-54f5646db6-cj62j              3/3     Running   0               2d18h
pod/kube-prometheus-stack-kube-state-metrics-6df68756d8-r59fh   1/1     Running   0               2d18h
pod/kube-prometheus-stack-operator-799b6d95b5-6nwfm             1/1     Running   0               2d18h
pod/kube-prometheus-stack-prometheus-node-exporter-7m2lk        1/1     Running   0               2d18h
pod/kube-prometheus-stack-prometheus-node-exporter-d8wn4        1/1     Running   0               2d18h
pod/kube-prometheus-stack-prometheus-node-exporter-l6qxw        1/1     Running   0               2d18h
pod/kube-prometheus-stack-prometheus-node-exporter-lpvxv        1/1     Running   0               2d18h
pod/prometheus-kube-prometheus-stack-prometheus-0               2/2     Running   0               2d18h

NAME                                                     TYPE        CLUSTER-IP      EXTERNAL-IP   PORT(S)                      AGE
service/alertmanager-operated                            ClusterIP   None            <none>        9093/TCP,9094/TCP,9094/UDP   2d18h
service/kube-prometheus-stack-alertmanager               ClusterIP   10.95.36.111    <none>        9093/TCP                     2d18h
service/kube-prometheus-stack-grafana                    ClusterIP   10.92.34.225    <none>        80/TCP                       2d18h
service/kube-prometheus-stack-kube-state-metrics         ClusterIP   10.95.111.104   <none>        8080/TCP                     2d18h
service/kube-prometheus-stack-operator                   ClusterIP   10.90.9.123     <none>        443/TCP                      2d18h
service/kube-prometheus-stack-prometheus                 ClusterIP   10.91.177.72    <none>        9090/TCP                     2d18h
service/kube-prometheus-stack-prometheus-node-exporter   ClusterIP   10.92.79.40     <none>        9100/TCP                     2d18h
service/prometheus-operated                              ClusterIP   None            <none>        9090/TCP                     2d18h

NAME                                                            DESIRED   CURRENT   READY   UP-TO-DATE   AVAILABLE   NODE SELECTOR   AGE
daemonset.apps/kube-prometheus-stack-prometheus-node-exporter   4         4         4       4            4           <none>          2d18h

NAME                                                       READY   UP-TO-DATE   AVAILABLE   AGE
deployment.apps/kube-prometheus-stack-grafana              1/1     1            1           2d18h
deployment.apps/kube-prometheus-stack-kube-state-metrics   1/1     1            1           2d18h
deployment.apps/kube-prometheus-stack-operator             1/1     1            1           2d18h

NAME                                                                  DESIRED   CURRENT   READY   AGE
replicaset.apps/kube-prometheus-stack-grafana-54f5646db6              1         1         1       2d18h
replicaset.apps/kube-prometheus-stack-kube-state-metrics-6df68756d8   1         1         1       2d18h
replicaset.apps/kube-prometheus-stack-operator-799b6d95b5             1         1         1       2d18h

NAME                                                               READY   AGE
statefulset.apps/alertmanager-kube-prometheus-stack-alertmanager   1/1     2d18h
statefulset.apps/prometheus-kube-prometheus-stack-prometheus       1/1     2d18h
Doing a query inside Prometheus UI
To be able to connect to the Prometheus UI we have to set some port forwarding. By running this command:
$ kubectl port-forward -n kube-prometheus-stack svc/kube-prometheus-stack-prometheus 9090:9090
Forwarding from 127.0.0.1:9090 -> 9090
Forwarding from [::1]:9090 -> 9090
By running the following command inside the UI you will see a Graph with the information gathered.
Example commands:
- node_disk_written_bytes_total
- cluster:node_cpu:ratio
- node_load5
Looking at the Grafana prebuild dashboards
To be able to connect to the Grafana instance we have to set some port forwarding. By running this command:
$ kubectl port-forward -n kube-prometheus-stack svc/kube-prometheus-stack-grafana 8080:80
Forwarding from 127.0.0.1:8080 -> 3000
Forwarding from [::1]:8080 -> 3000
Login details for Grafana are:
Admin
prom-operator
Once you are in the dashboard you can look at -> Dashboard -> General and see all the prebuild dashboards that you can use.
If you click on -> Kubernetes -> Compute Resources / Cluster you get to see some cluster information that is being collected by Prometheus.
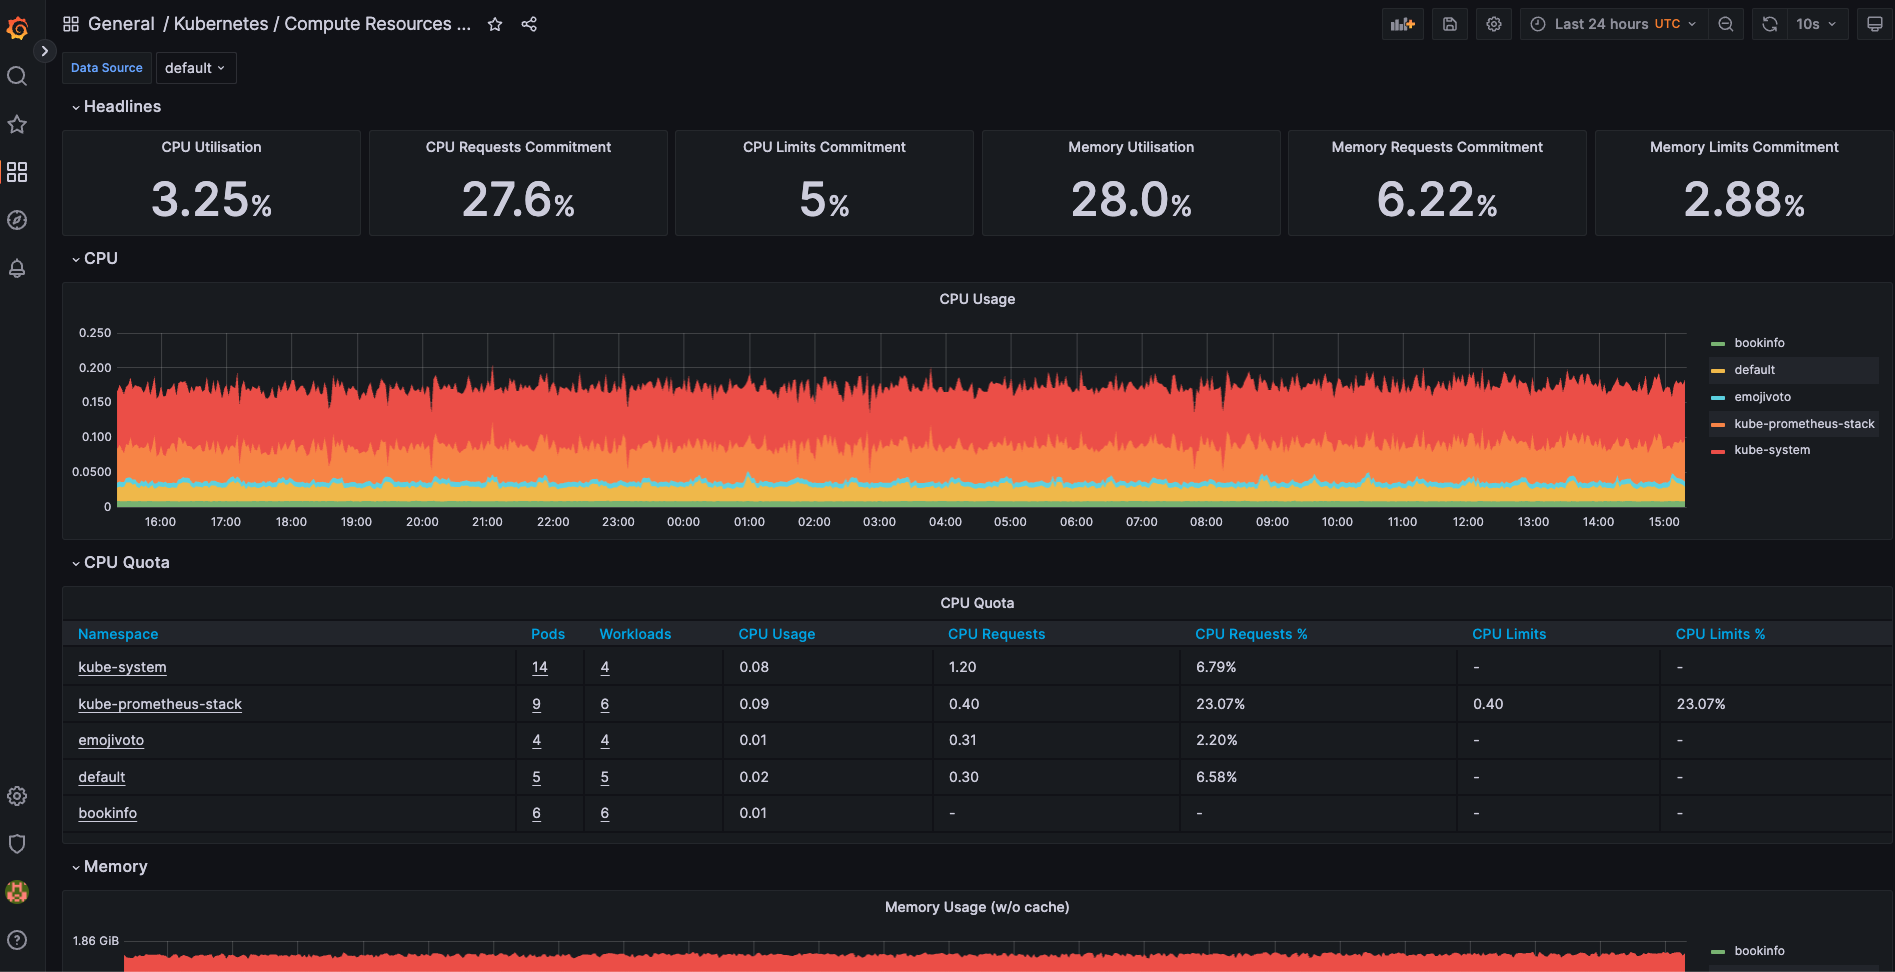 In this picture above you see my cluster information at the moment of writing this blogpost.
My cluster does have some information in it since I already have deployed some demo/test applications on my cluster.
In the dashboard, you get to see useful information like:
In this picture above you see my cluster information at the moment of writing this blogpost.
My cluster does have some information in it since I already have deployed some demo/test applications on my cluster.
In the dashboard, you get to see useful information like:
- CPU Utilisation
- CPU Requests Commitment
- CPU Quota with information on all the namespaces
- Graphs for Memory on all the namespaces
- Network usage on all namespaces
And so much more! Remember this is only one dashboard and there are so many more to explore with different kinds of data from the Kubernetes cluster.
Summary
For me, this was a fun way to introduce myself to the kube prometheus stack while testing out a Beta Kubernetes platform which is kinda nice. Breaking, building or creating new stuff with Kubernetes is fun and exciting, still a lot to learn and discover in this big world of Cloud Native.